Thursday 7 May 2009

IDAT 101 - Part 2 - Intervention


"The Intervention Project requires you to make an intervention
in the context provided by your site. This may extend the first terms project,
manifest itself as a physical intervention, a virtual construction, a
performance, further documentation, a video, etc."


The original plan for my intervention was to enter the train Station with a model based on the human form and what space we consume while moving, I wanted to see how I could effect the movement round the space which I had researched in the earlier segment of the project. being unable to record in the station I had to re-assess my plan.


I then decided that recording in the student union would be a better way to go. So came up with a Recording protocol.


The problem was in order to get accurate reactions from the people in the Student Union the recording would need to be discrete. The powers that be said that the only way I could record inside would be if I got everybodys permission that I recorded before hand. Which would have made the recording inaccurate and would defeat the object of the intervention so it was back to the drawing board.


Working on my original idea of using locational movement as an intervention within the station I came new idea. A train station is a point of a journey, people carry their luggage to and from and without realising it intervene with the people around them. I took this concept and enlarged my environment. My plan was to create my own journey from my house on North hill to the train station, the plan was to carry as many bags as I could handle along a pre-planned path and document it using video. Carrying a larger amount of bags increased my surface area, making people want to avoid me, plus if I am seen carrying a lot of luggage people assume its easier for them to move. The interventions I was aiming to capture were not just me getting people to just change where they walk, but their physical reactions are important to, whether its a head turn, a smile or even something to chat about. I asked a friend to record the footage for me and we documented the journey both to the station and back. This allowed me to to get as many interventions as I could. Here is a map of my path and the positions of the cameras along the way.

The yellow dots symbolise the camera placements on the way to the station, the
blue dots are the placements on the way back and the green dot symbolises the
position of the camera used in both legs of the journey.camera positioning is
very important, it allows you to get the best possible shots for the situations.


I decided to speed up some of the footage to 800% to give an idea of the journey and then kept the important interventions at normal speed. This also means that the interventions are displayed a lot more obviously. Using the song "Miss You - By Trentmoller" it created a good background sound withought distracting from the video footage itself. It alose works really well with both the fast and slow parts of the visualisation. The music itself gives an idea of movement. Here is my outcome;


Tuesday 5 May 2009

IDAT 106 - 7 Final outcome

Working with the greenscreen and the sensors I came up with the temperature clock. At first I was looking at the difference in temperature between the outside and the inside of Portland Square. But I saw that the data did not change for the inside temperature. Misfortune and Technical issues gave me the opportunity to reconstruct my visual representation of temperature time. I thought about creating a shape which changes size based on temperature (based on the idea that heat causes stuff to expand) and when the size increases so does the colour temperature. i.e in cold weather small blue shape, in warm weather large shape with colours ranging from blue to red.


Looking at the masking tool on Flash I created a background layer which created the temperature gauge, cold colours in the centre gradually moving out to hotter colours on the outside.

I then created the mask layer which would be the one changing size and therefore displaying the temperature. For this I created a snowflake/flower shape, snowflake would work during the winter and colder months because the light blue colours would symbolise cold (ice) or flower for the warmer months, this would be a lot more colourful ranging from light blue to pink, red and orange.


Below is the outcome of the mask, this shape will resize with the code revealing the different colours.


Then moving on to the coding aspect, I acquired an actionscript 3 parser off a fellow peer. and using the sensors I created an "if" statement to change the size of my mask based on the temperature.


"if (CurrentTemp less than 0){
Resize(9.2); }"

This resized my mask creating the variation in size and colour based on the readings from the sensor (outside temperature). (Resize refers to a function created elsewhere in my code) The next challenge was to created the clock, for this i had to find the code to grab the number of minutes, hours and seconds from the current time I then had to make the code think that the 60th second , 60th minute and the 24th hour was at the top of the screen and 59th second, 59th minute and 23rd hour were at the bottom. Changing the position of my temperature gauges according to the time created my temperature clock.
This represents the temperature at less than 0 degrees:
Has the appearance of a snowflake which is relevant to the temperature.


This represents the temperature at less than 15 and above 10 degrees:
Brighter more vibrant colours increase with the temperature.

This represents the temperature at more than 30 degrees:
Summer temperature, Looks a like a flower now, which relates with the bright vibrant colours of summer months.


Here is a screen shot of my clock after 5 hours:


Looking at the movement within the my piece I thought it needed something else. So i decided to use another sensor number 37 which measures the wind speed. The shapes use now rotate speed relevent to the wind speed. So my final outcome visually represents both wind and temperature in the format of dropping shapes using the basis of a clock.

Here is my visual information display device or temperature clock.


Tuesday 10 March 2009

IDAT 106 - 6 Project Final Piece Proposal

For my final project I am planning on developing my work with the Greenscreen using data collected from the Arch-os system . Using the idea of the "difference between" and exploring inner and outer temperature I plan to create a visually stunning representation of real life data. Using time to move the piece I will look at different shapes and forms to use as my objects. I also plan to add an element of history i.e showing the shapes that happened an hour, a minute or even a second before. This will create interesting patterns and hopefully will be aesthetically pleasing.
Screenshot of basis for final project
Taken at 14:39

IDAT 106 - Synthesis

Looking over the module so far I think that I have definately learnt to open my eyes more to what is going on around me. Working with these projects I have been asked to look deeper into the interaction of people and there surroundings.

In the first I learnt notation, how to show stuff visually which you cant nessasarily see or think about in a stationary photo i.e movement and density of populus. This has given me some good possible leads to follow in my final project and also I feel I have come up with some credible outcomes. The second worksop worked well off the back of the first one, this was were I mapped both GPS and bluetooth data, this enabled my to put something visible into a space. Whether it was coloured lines which represented invisible connections or a path which you wouldnt otherwise be able to see. Creating art by just walking round buildings filling a space with digital data. Then moving on to the live streaming section where I was given data to work with and I then came up with a visual outcome wich otherwise would have been invisible. The temperature clock, it allowed you to see the difference between the inner and outside temperatures of the building while giving a good idea of the time. Granted if i wanted it to be a functional piece it would need more work but visually its a good start. All in all, I have learnt that even if stuff is invisible it doesnt meen it cant be visibly represented.

IDAT 106 - The Territory: Deep ecology - Live Video Streaming and Greenscreen

Live Streaming

For this section of the module I am looking at Live Streaming whether it is using video or the Greenscreen.


Video

Live streaming has become a reality, with more an more websites offering the chance to stream video live from your mobile phone or computer straight to their site. One sight which offers such a facility is http://qik.com/ Here is a screenshot of there recent video gallery containing both live and recorded videos:

Live Streaming websites are improving along with the hardware available. The picture quality differs depending on the camera the user is using along with the network connection of the users.

The use of live streaming is having a major effect on our lives, with video calling available on phones and instant messengers and live lessons given by teachers enabling their students to learn from home. It also enables you to share important moments such as birthdays live with family members on the other side of the world.


Arch-OS

"An 'Operating System' for contemporary architecture (Arch-OS, 'software for buildings') has been developed to manifest the life of a building and provide artists, engineers and scientists with a unique environment for developing transdisciplinary work and new public art." - http://www.arch-os.com/


It is based in the Portland square building of the university campus, it takes in different sets of information from sensors and cameras all over the building inside and out and relays it in data form. The sensors used by the Arch-OS system take in data such as are inside and outside temperature, CO2 levels and wind speed. The idea of the data collected is to show that the building is alive, it has a pulse or a heart beat, a changing temperature and I suppose it is correct. Every building has a flow of people much like a bloodstream a change in CO2 much like our own bodies and also a change in outer and inner temperature. The Arch-OS supplies all its data from the building live and at no cost so is freely available to those who which to benefit from its use one of these uses is to create data based images for the Greenscreen.

Greenscreen

The Greenscreen is a large mesh of 50 x 80 LED's each of which have the ability to display an array of colours. The screen has the potential to show anything up to a resolution of 330 x 500 pixels, but to get the best visual effect its best to use contrasting colours.

The Arch-OS data has been used to create visual models which have been displayed on the Greenscreen. Here is one video which I have found that shows a previous interactive project, its entitled Noogy. Noogy is a digital personality created by the Arch-OS data, you can text and get your message displayed live on the screen, if its windy his hair will move and if the sensors aren't detecting any movement inside Noogy gets bored and plays PONG. You can also see Noogy at http://www.noogy.org/2006/hello_noogy.cfm.


Outcome

For my outcome in this section I chose to work on the Greenscreen using the live data collected from Arch-OS.

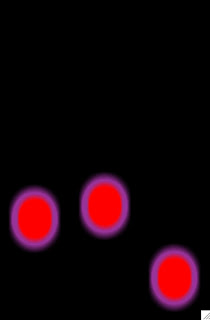
I chose a subject to work title to work on this project and it is "The difference between" and I chose to do the difference between the inside and outside of Portland Square. Using two sensors one for inside temperature and one for out I have created 3 circles, the inner circles symbolise the inside temperature of the building, the outer circle symbolises the outside temperature. I then set up the circles so they work from a clock, the one on the right moves down every second, the one in the middle moves every minute and the one on the left moves every hour. The clock displayed shows the time is 02:29:46.

The temperature changes a different colour at every 5 degrees. There are eight different colours and the temperatures stop changing colour below 0 degrees (cyan) and above 30 degrees (yellow).

The good thing about this clock is it will change colour all year round, morning to night.

IDAT 106 Ecology and Workspaces

IDAT 106 Ecology and Workspaces

An Introduction

Here is an introductionary quote given to us in our brief:

"Ecology (from Greek: οίκος, oikos, "household"; and λόγος, logos, "knowledge")is the scientific study of the distribution and abundance of life and the interactions between organisms and their natural environment. The environment of an organism includes physical properties, which can be described as the sum of local abiotic factors such as insolation (sunlight), climate, and geology, and biotic ecosystem, which includes other organisms that share its habitat."

In this module I will be studying the key elements of social ecology. I will do this by taking photos, notating and studying the unobvious elements which effect our interactions with our surroundings and others within it. The work will be split into three workshops:

  • Time-based photograph - Picnic
  • GPS and Bluetooth
  • The Territory: Deep ecology - Live streaming and Greenscreen

This will all leed up to a final project in which I will incorporate elements from the workshops. This piece will envolve some sort of live streaming of visual information.

I will use this blog to keep track of all the work I have done and use as a workbook showing the processes I work through.

Tuesday 20 January 2009

GPS Narrative

Here is my narrative for the GPS project. Using photos to show the scene and flash for the movement through my GPS map.

Thursday 15 January 2009

Idat 101 - Part 1 - Time Relevant Data collection

This is the layout of the trainstation in which we took the data.


Here is the data we collected, our plan is to use this for our final model.


For final presentation and models go to: